Copy this text
Inter- and intra-annual frequency variations of large-whale calls in the southern Indian ocean
In the past decades, an inter-annual decline of the frequency of blue whale calls is been observed worldwide (Mc Donald et al., 2009), along with an intra-annual variation, best described for the Antarctic blue whale calls (Balaenoptera musculus intermedia) (Gavrilov et al., 2011; Gavrilov et al., 2012; Miller et al., 2014). The reasons for this decline and variations are still not understood.
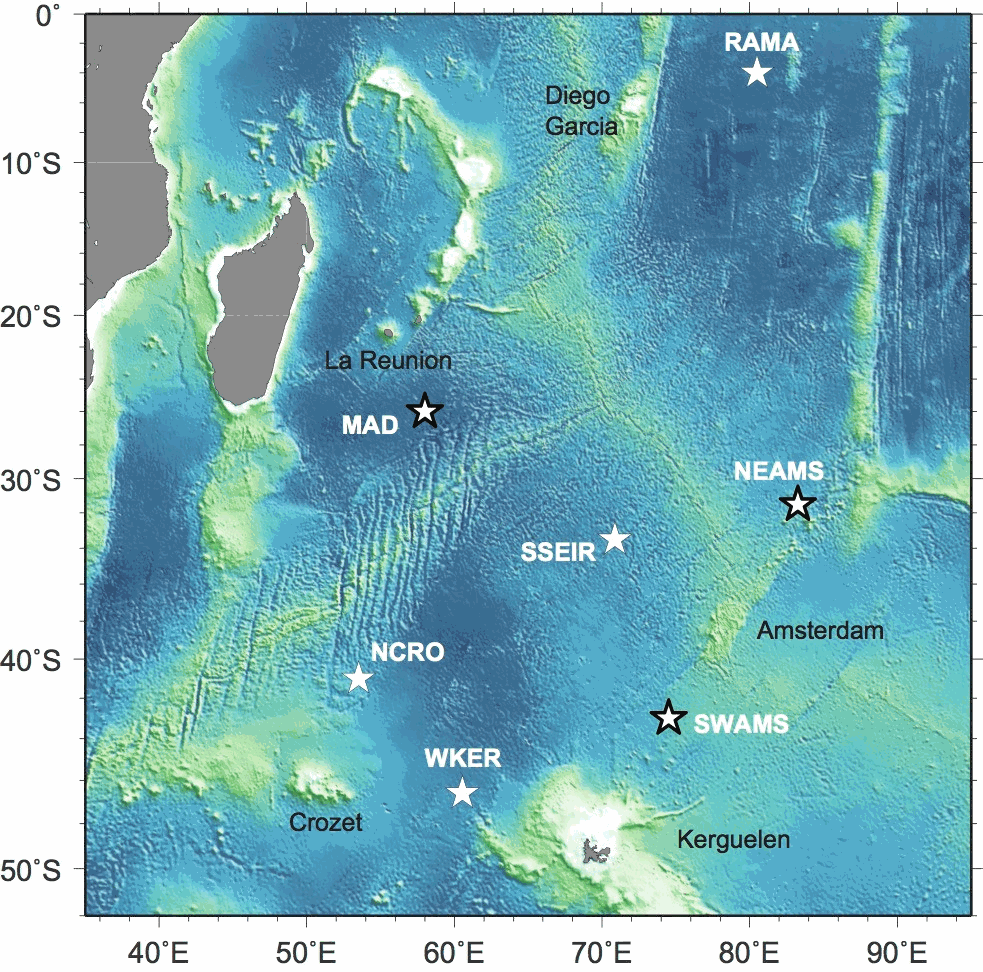
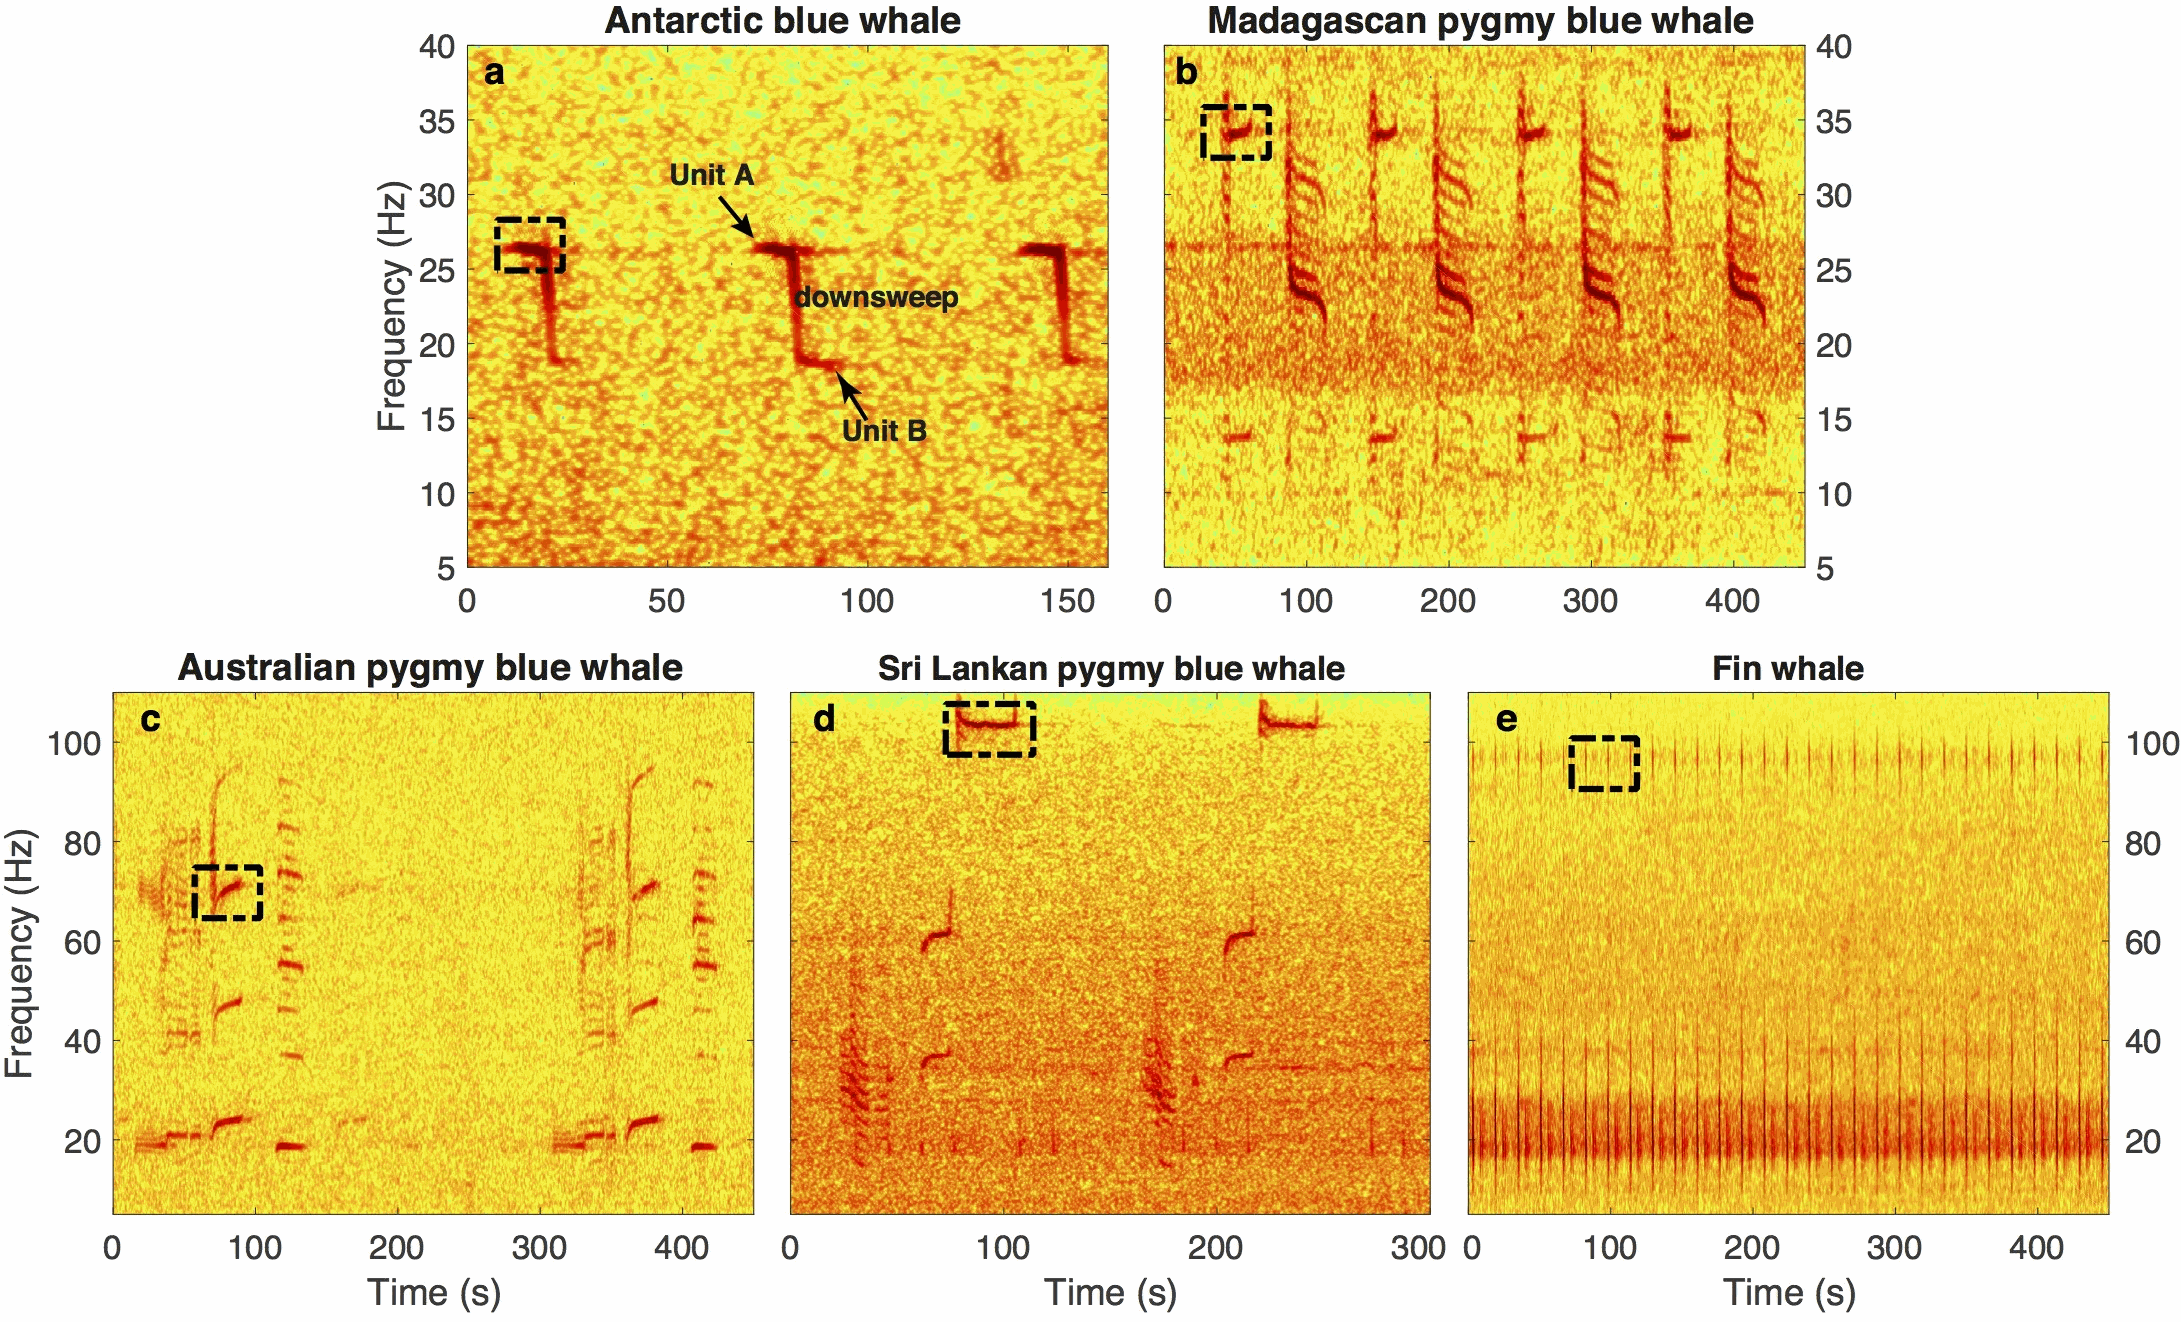
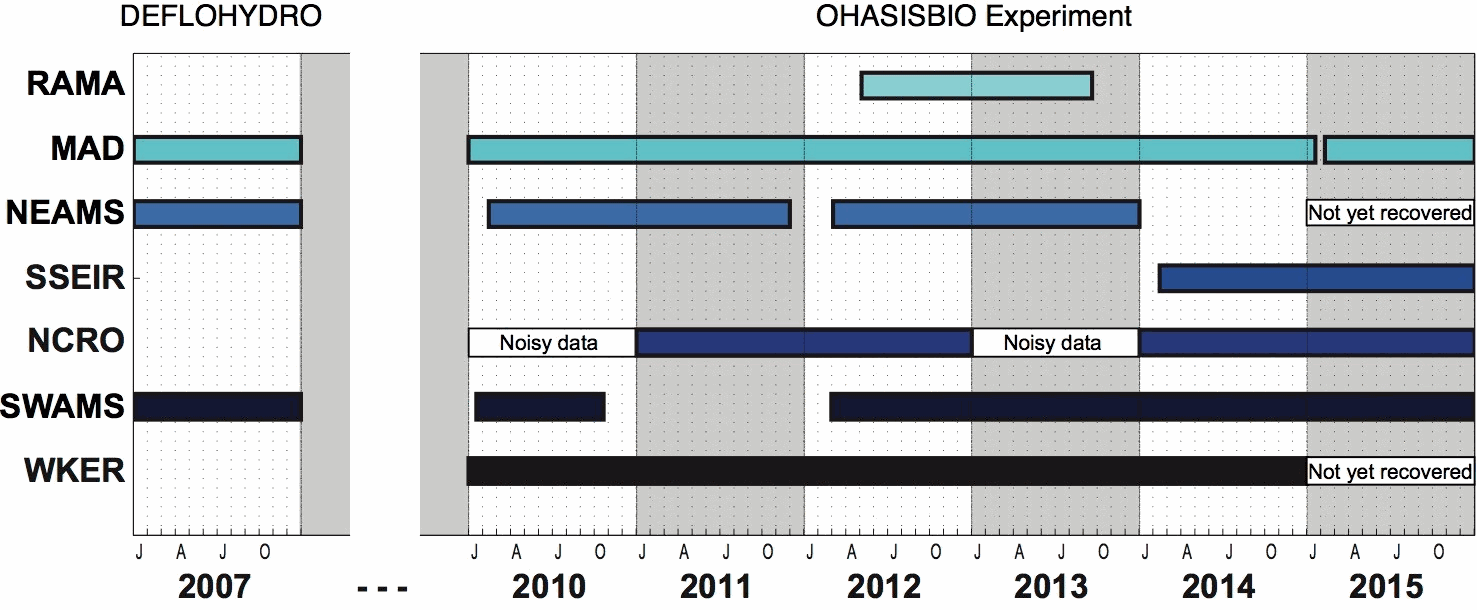
During the DEFLOHYDRO project, a network of 3 autonomous hydrophones (MAD, NEAMS and SWAMS sites; Fig. 1) was deployed in the southern Indian Ocean from November 2006 to January 2008 to monitor the low-frequency sounds (0-120 Hz) carried by the ocean, and provided a complete year of acoustic data in 2007. It was continued by the OHASISBIO project, a network of 6 to 8 autonomous hydrophones deployed in January 2010 and still operational (August 2017; Fig. 1). These acoustic data sets reveal the seasonal presence of several species and sub-species of large baleen whales: the Antarctic blue whale (Balaenoptera musculus intermedia), three acoustically distinct pygmy blue whale populations (B. m. brevicauda), and the fin whale (B. physalus). Each of these populations has a specific vocal signature (Fig. 2). The pluri-annual and multi-site acoustic data collected by the DEFLOHYDRO and OHASISBIO hydrophone networks provide a continuous monitoring (Fig. 3) of the frequency of these vocal signatures. Inter- and intra-annual frequency variations of the Antarctic blue whale call are confirmed, and an inter-annual frequency decline is also observed for the other whale species (for the first time for the Madagascan pygmy blue whale call and the fin whale 100 Hz-pulse).
This database gives the frequency measurements for five populations of whales recorded in the southern Indian Ocean. For the Antarctic blue whale, they are based on individual Z-calls (unit A), automatically detected with a Z-detector (Socheleau et al., 2015; Leroy et al., 2016). For the other whales, frequencies correspond to specific units of interest (black boxes in Fig. 2) and are measured at peak power in Power Spectral Densities (PSD). Frequencies are provided for all sites when the given vocal signatures are present, in 2007 and from 2010 to 2015.
We also provide daily average noise power-level in different frequency ranges (10-13 Hz, 30-33 Hz, 64-66 Hz, 71-73 Hz, 91-93 Hz, 99-101 Hz) calculated in the data recorded from 2010 to 2015. The seasonal variations of the call frequencies would be linked to the noise level. An interpretation of these data is discussed by Leroy et al. (2017).

Figure 1 : Layout of the DEFLOHYDRO (stars with black contour) and OHASISBIO hydroacoustic stations (all stars) in the Southern Indian Ocean. © J-Y Royer / CNRS-U.Brest LGO

Figure 2 : Time-frequency representation of stereotyped vocal signatures of Antarctic (a) and pygmy blue whales of the Madagascar (b), Australia (c), and Sri Lanka (d) type, and of fin whales (e). Frequencies in the data base correspond to the peak frequency (i.e. at maximum amplitude) in the black rectangles. ©E Leroy/ U.Brest-CNRS LGO

Figure 3 : Acoustic data recorded by the DEFLOHYDRO and OHASISBIO hydrophone networks. © E Leroy / U.Brest-CNRS LGO
Disciplines
Environment
Location
4N, -46S, 83E, 50W
Devices
The sound levels, given in dB/Hz re 1 microPa2, are corrected for the hydrophone sensitivity and gain.

